- 888-987-6558
- support@webelect.net
Voter Scoring
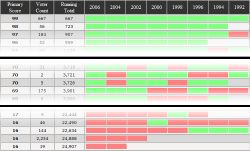
Voter Scoring is a powerful component of the webElect.net voter targeting system. The score is used as a basic measure of predictability that a voter will vote. Scores range from 1 to 99 with 1 representing voters with the worst history and 99 being voters with the best. The score is calculated by analyzing the voters participation in elections since their registration date (up to the last eight elections) and adding or deducting points from a base score based on participation. The amount of change an election has on the score is determined by how recent the election was. The balance between positive change or negative change is influenced by what the statewide turn-out was for that election.
Two Scores - Primary and General
Separate scores are calculated for primary elections and general elections. Some voters consistently vote in general elections, but not in primaries. Some vote consistently in both, and some registered voters simply don't vote in either. The dual scoring of voters allows you to focus your campaign efforts and dollars on voters that count. For example, you can target your campaign mailings for a primary election to only include those voters who actually vote in the primary. Likewise, canvasing neighborhoods before a primary election can be focused on the small percentage of households that vote consistently in the primaries.
How is using Scoring better than traditional selection methods?
Typically campaigns will select voters using a "2 of 4" or "3 of 4" selection process meaning a voter had to vote in at least 2 or 3 of the last 4 elections. Using a "3 of 4" selection means a voter that has only been registered for 2 elections and voted in both will be overlooked. Using a "2 of 4" selection means a voter that has not voted in the most recent 2 elections may still be included. Both of these problems are solved using the Score ranking to select voters.
About the scores.
There are several components included in calculating the scores assigned to each voter. Some of these include:
-
- Voter Registration date.
- Voting consistency in primary elections weighted by recentness of election.
- Voting consistency in general elections weighted by recentness of election.
- Statewide turn-out for general elections.
| Election Year | Turn-Out | Total Weight | Voted (add) | Missed (deduct) | Not Registered |
|---|---|---|---|---|---|
| 2024 | 79% | 24 | 11 | 13 | - |
| 2022 | 54% | 23 | 14 | 9 | - |
| 2020 | 77% | 16 | 7 | 9 | - |
| 2018 | 63% | 14 | 8 | 6 | - |
| 2016 | 74% | 10 | 4 | 6 | - |
| 2014 | 51% | 6 | 3 | 3 | - |
| 2012 | 71% | 3 | 1 | 2 | - |
| 2010 | 49% | 3 | 1 | 1 | - |
| Election Year | Total Weight | Voted (add) | Missed (deduct) | Not Registered |
|---|---|---|---|---|
| 2024 | 30 | 23 | 7 | - |
| 2022 | 23 | 17 | 6 | - |
| 2020 | 16 | 11 | 5 | - |
| 2018 | 11 | 7 | 4 | - |
| 2016 | 8 | 5 | 3 | - |
| 2014 | 5 | 3 | 2 | - |
| 2012 | 3 | 2 | 1 | - |
| 2010 | 2 | 1 | 1 | - |
Last updated by Doug Homan, created January 18, 2016

